GeoVision Example Gallery
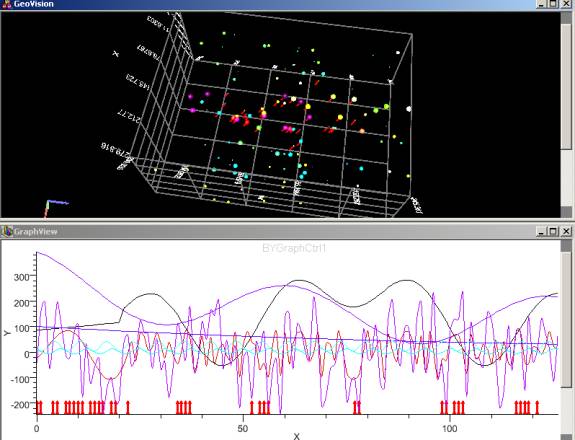
Interactive
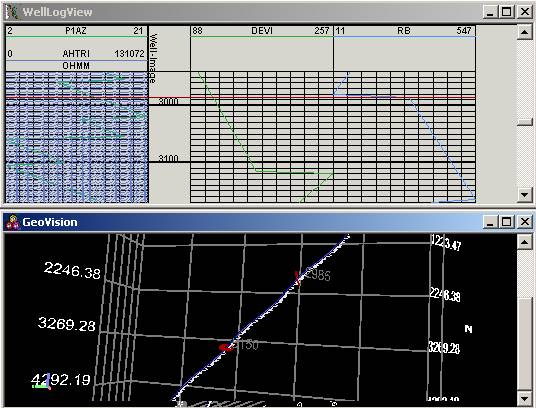
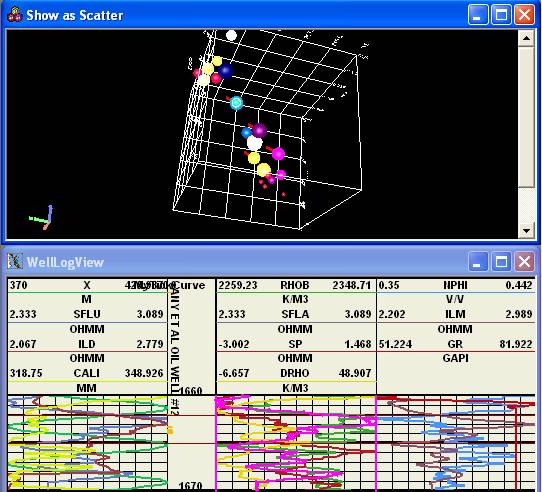
operation between log data and track data
Marker on the track is corresponding with the index in log data
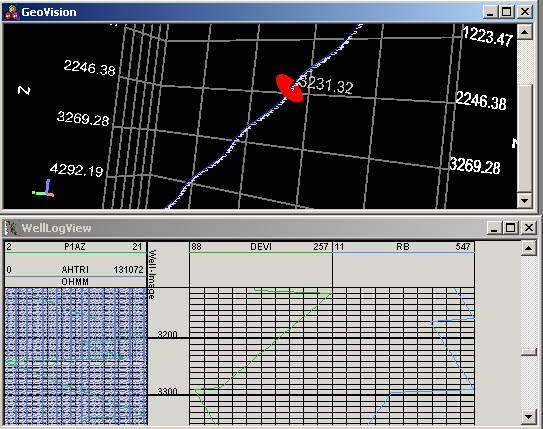
Zones in log data are mapped with markers on the track
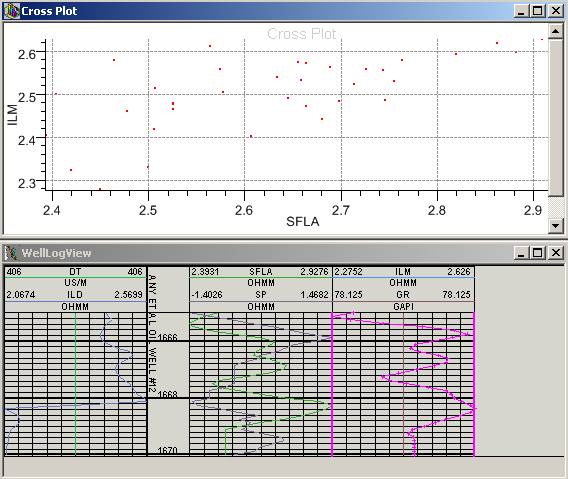
Interactively
exam log data
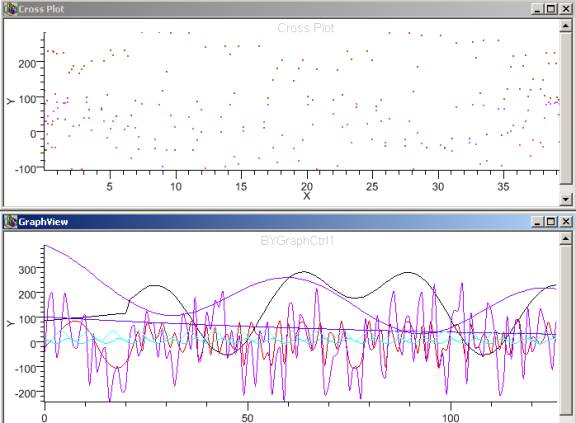
Generate cross plot by selecting two log curves
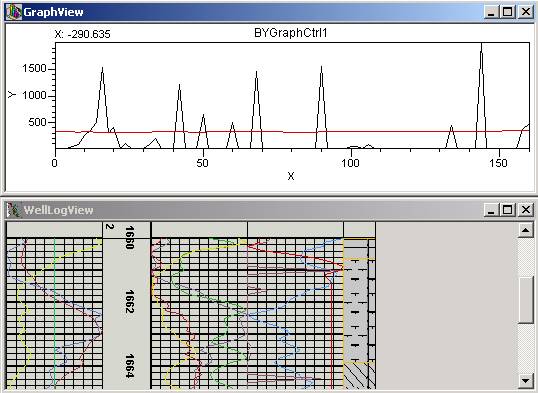
Copy selected log curves in BYLog view and paste them in BYGraph view
Generate Multi-Dimension data using log curve data within zone

Map multi-dimension data’s indices with marker in
BYLog view
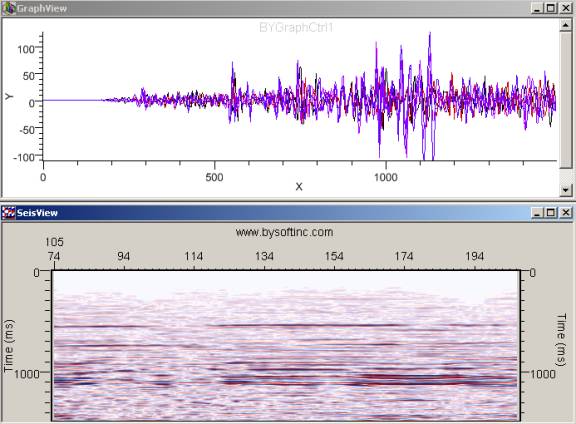
Interactively
exam SEGY
data
Pick trace header’s information and display it in BYGraph view
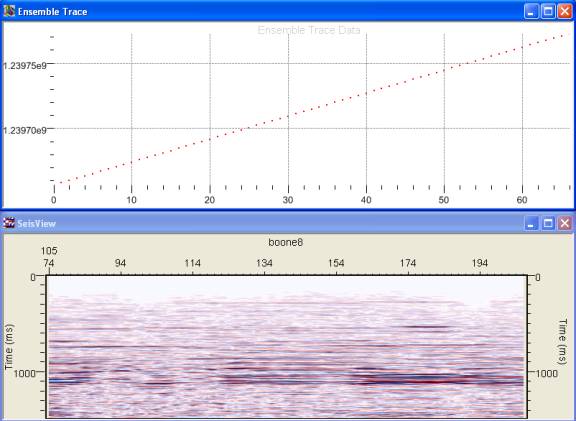
Copy selected trace curves in BYSeis view and paste them in BYGraph view
Interactively
exam curve
data
Generate Multi-Dimension data by curves
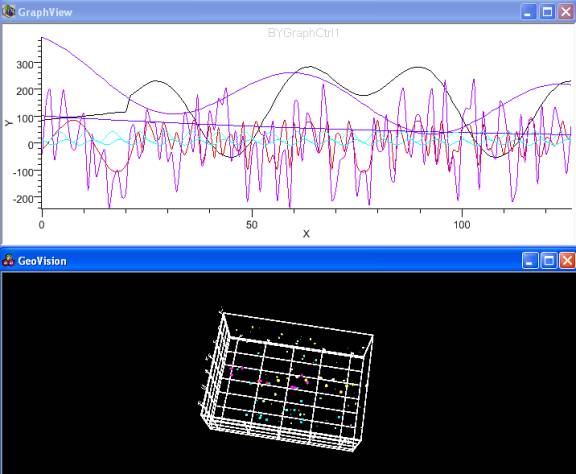
Map multi-dimension data’s indices with marker in BYGraph view
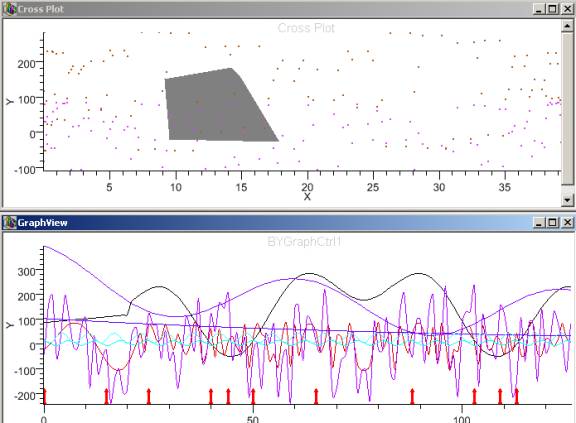
Generate cross plot by selecting graph curves
Show
selected points’ indices with markers in BYGraph view
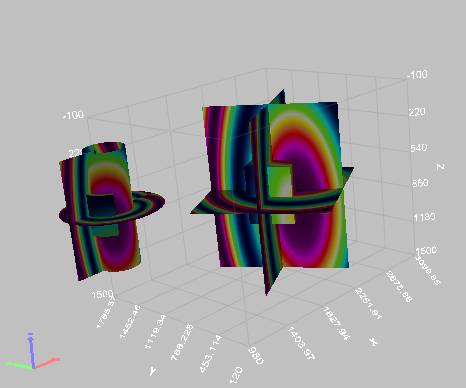
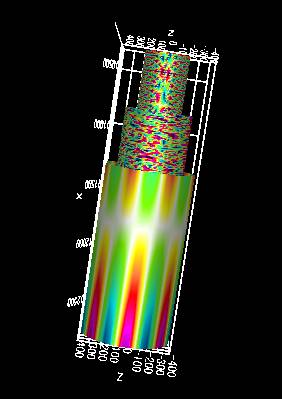
Generate volume data (polar coordinate) and well volume data.
Simulate PipeLine Flow

GeoVision
Find out more information about our product.
home
| about
us | service
and support |
contact
us | sitemap
(c) 2005 BYSoft Inc.
For any
questions or concern, please contact info@bysoftinc.com
